UI UX

Product Innovation

Sustainability

AI + Arduino Coding
Heatscape

for Interactive Product Design Studio at USYD


Product Design

Interactive

Product Design

Studio @ USYD

Team of 3

3 Months

Stay cool and safe with AI in rising temperatures.

Learn More

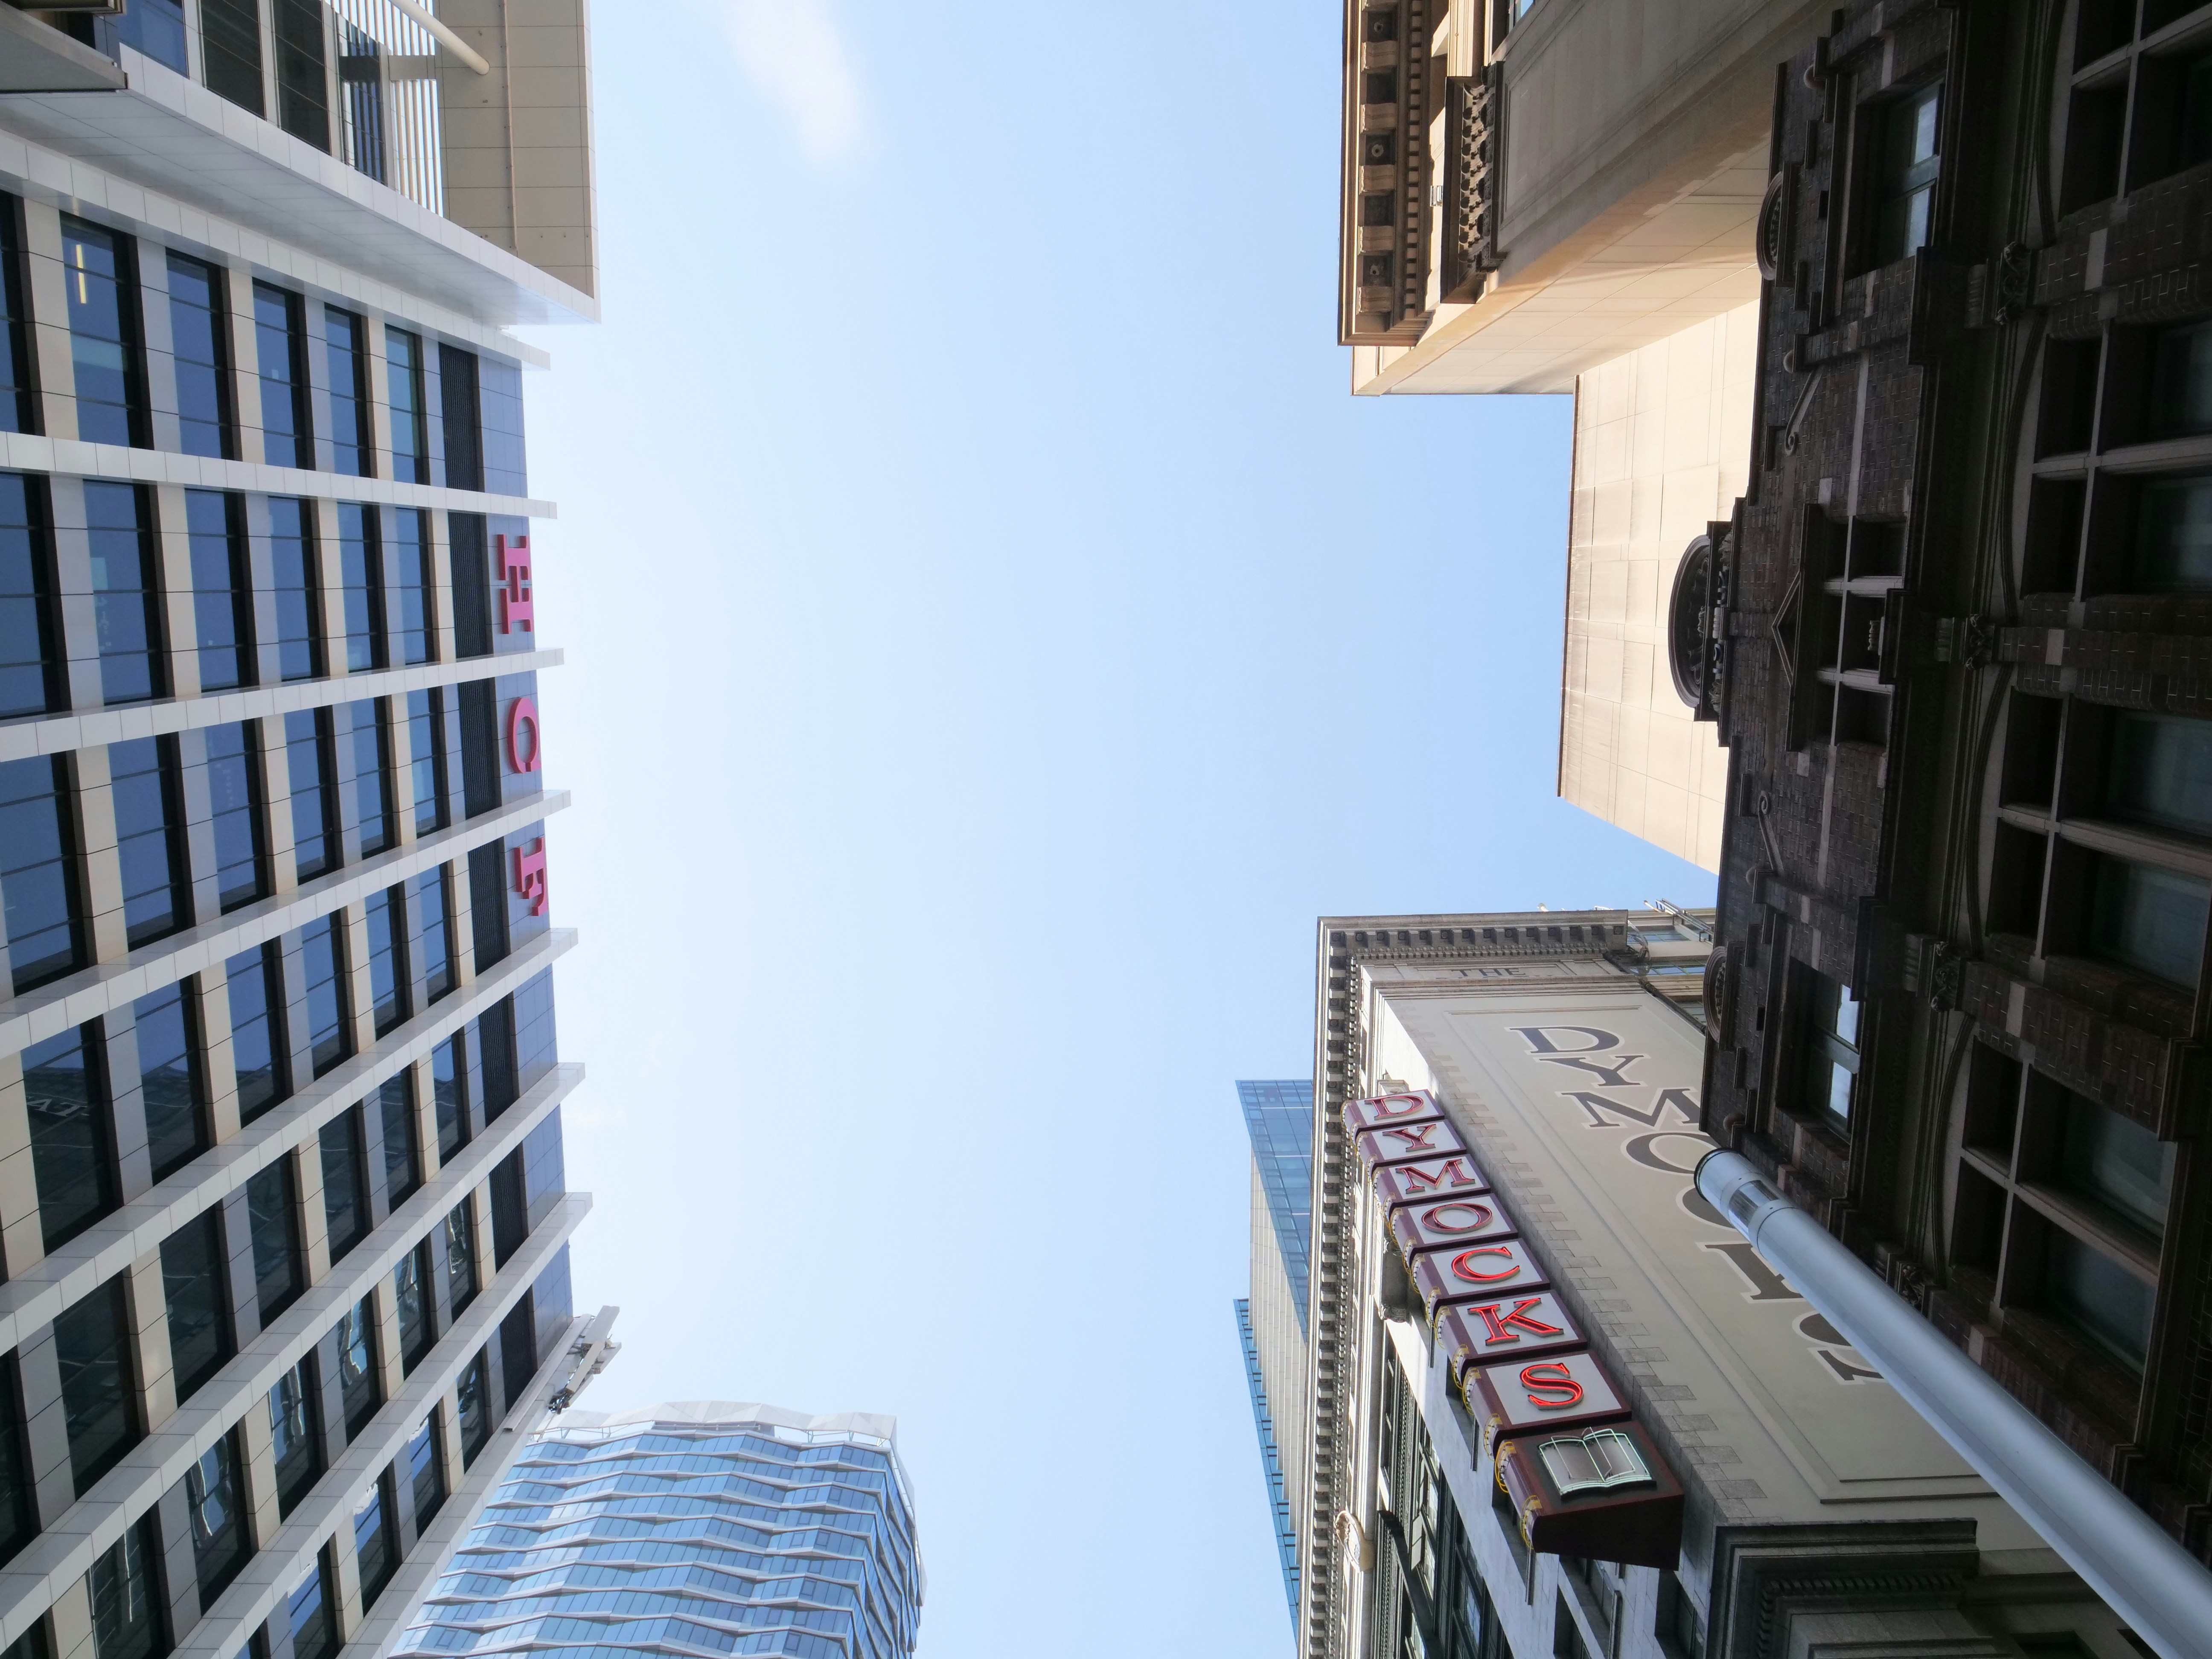
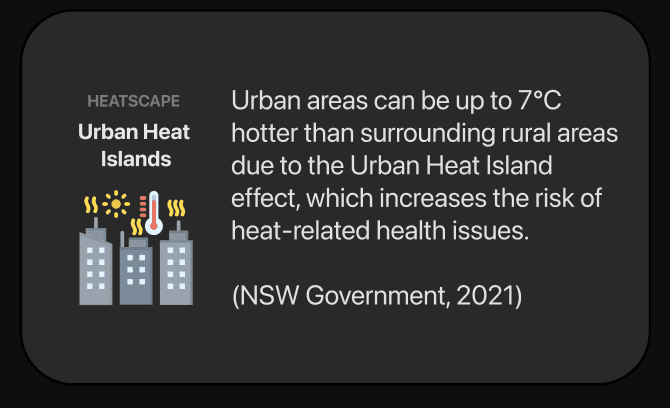
Temperatures are rising fast in the sydney cbd.

there is a growing risk of heatwaves and health effects as this trend continues. (nsw Govt, 2021)

We explored existing data, literature, and market trends to map the impact of urban heat.

By analysing global case studies and quantitative data, we identified key areas in Sydney where the issue is most urgent, setting the context for our design.

Temperatures are rising fast in the sydney cbd.

there is a growing risk of heatwaves and health effects as this trend continues. (nsw Govt, 2021)

We explored existing data, literature, and market trends to map the impact of urban heat.

By researching global case studies and quantitative data, we identified key areas in Sydney where the issue is most urgent, setting the context for our problem.

Try Prototype

Learn More

Problem Statement

Problem Statement

Discover --|-- Define --|-- Develop --|-- Deliver

Discover --|-- Define --|-- Develop --|-- Deliver

How might we mitigate the impacts of rising temperatures and enable adaptation to climate change in urban areas so that we meet the holistic disaster risk management principles outlined in the Sendai Framework for Disaster Risk Reduction 2015-2030?

How might we mitigate the impacts of rising temperatures and enable adaptation to climate change in urban areas so that we meet the holistic disaster risk management principles outlined in the Sendai Framework for Disaster Risk Reduction 2015-2030?

Design Process

Design Process

01

Discovery and User Research

Conducted user interviews, surveys, and competitor analysis to identify how users manage extreme heat. These insights guided our approach, focusing on integrating real-time, accessible solutions.

02

Concept Development

We conducted user interviews, surveys, and analyzed in-app analytics to understand the pain points and user needs. We also studied competitor apps and industry trends to gather insights

03

Low-Fidelity Prototyping

We conducted user interviews, surveys, and analyzed in-app analytics to understand the pain points and user needs. We also studied competitor apps and industry trends to gather insights

04

Usability Testing & Iteration

We conducted user interviews, surveys, and analyzed in-app analytics to understand the pain points and user needs. We also studied competitor apps and industry trends to gather insights

05

MVP Coding & Final Showcase

We conducted user interviews, surveys, and analyzed in-app analytics to understand the pain points and user needs. We also studied competitor apps and industry trends to gather insights

01

Discovery and User Research

Conducted user interviews, surveys, and competitor analysis to identify how users manage extreme heat. These insights guided our approach, focusing on integrating real-time, accessible solutions.

02

Concept Development

We conducted user interviews, surveys, and analyzed in-app analytics to understand the pain points and user needs. We also studied competitor apps and industry trends to gather insights

03

Low-Fidelity Prototyping

We conducted user interviews, surveys, and analyzed in-app analytics to understand the pain points and user needs. We also studied competitor apps and industry trends to gather insights

04

Usability Testing & Iteration

We conducted user interviews, surveys, and analyzed in-app analytics to understand the pain points and user needs. We also studied competitor apps and industry trends to gather insights

05

MVP Coding & Final Showcase

We conducted user interviews, surveys, and analyzed in-app analytics to understand the pain points and user needs. We also studied competitor apps and industry trends to gather insights

These are the key pain points we found.

Through on-ground observations, interviews, and ethnographic studies, we uncovered how people adapt to extreme heat in Sydney. These insights into user behaviour and coping mechanisms directly informed Heatscape’s design, ensuring our solution addressed real user needs.

Through on-ground observations, interviews, and ethnographic studies, we uncovered how people adapt to extreme heat in Sydney.

Urban Green Areas Provide Relief 🌳 Parks and open spaces are noticeably cooler compared to densely built-up areas.


Heat Stress Often Triggers Delayed Reactions 🔄
People typically respond to heat only after experiencing physical discomfort or symptoms.


High Heat Limits Outdoor Activities 🚫
Excessive temperatures push people to seek indoor cooling or shaded environments.

Ideation

Ideation

Next, we brainstormed over 30 feasible features…

We brainstormed

over 30 feasible features.

Outdoor Heat Can Stop Outdoor Activities


“Because you cannot take a walk outside when it is so hot. You are restricted to staying indoors.”

People Wear and Bring Accessories to Reduce Sunlight Heat


“I've carried [my umbrella] pretty much every day because it's just very small, so it's handy to have. It stays in my bag until I need it.”

People Only Respond After Seeing Effects of Heat

“Veekna got heat stress from relaxing in the rose garden at UTS for too long, she didn’t realise it until she had to get up.”

High Heat Causes Health Issues


“Exhausted, [the heat] drains your energy. It gives me migraines. I get like migraines from the sun if it's too sunny.”

Air Conditioning is Effective, But Costly at Home

"Sometimes we just save. We don't turn on the aircon just to save the energy.”

People Use Indoor Public Spaces to Cool Down


“It usually feels cooler inside shopping centres.”

Height and Density of Buildings Affect Temperature


“The city, more congested areas, areas with like a lot of buildings. Not a lot of trees, the trees-to-buildings ratio don't really match.”

Urban Green Areas Reduce Heat


“A clear and open space, probably like parks, is less hot than on the street, which has more tall buildings.”

Height and Density of Buildings Affect Temperature


“The city, more congested areas, areas with like a lot of buildings. Not a lot of trees, the trees-to-buildings ratio don't really match.”

Each person chose one feature.


Our chosen features were merged together

to create the first product prototype.

Each person chose one feature.


Our chosen features

were merged together to create

the first product prototype.

Thermo Patch

@Gautham

A wearable device using hardware Peltier elements to provide on-demand cooling.

Temp Tracker

@Vincent

Application for Smart Watch, that tracks the user’s body temperature and I guess connects to an app that has information regarding heat-related infographics in Sydney.

Heat Maps

@Anson

A web app that helps people navigate crowded urban areas.

A map overlay showing areas with high foot traffic, allowing users to plan routes and avoid crowded spots.

Paper Prototyping
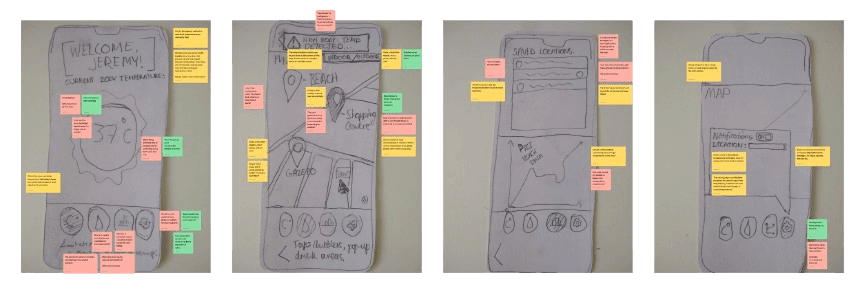
Going from define to develop phase involved lots of paper and sticky notes for testing.

Going from define to develop phase involved lots of paper and sticky notes for testing.

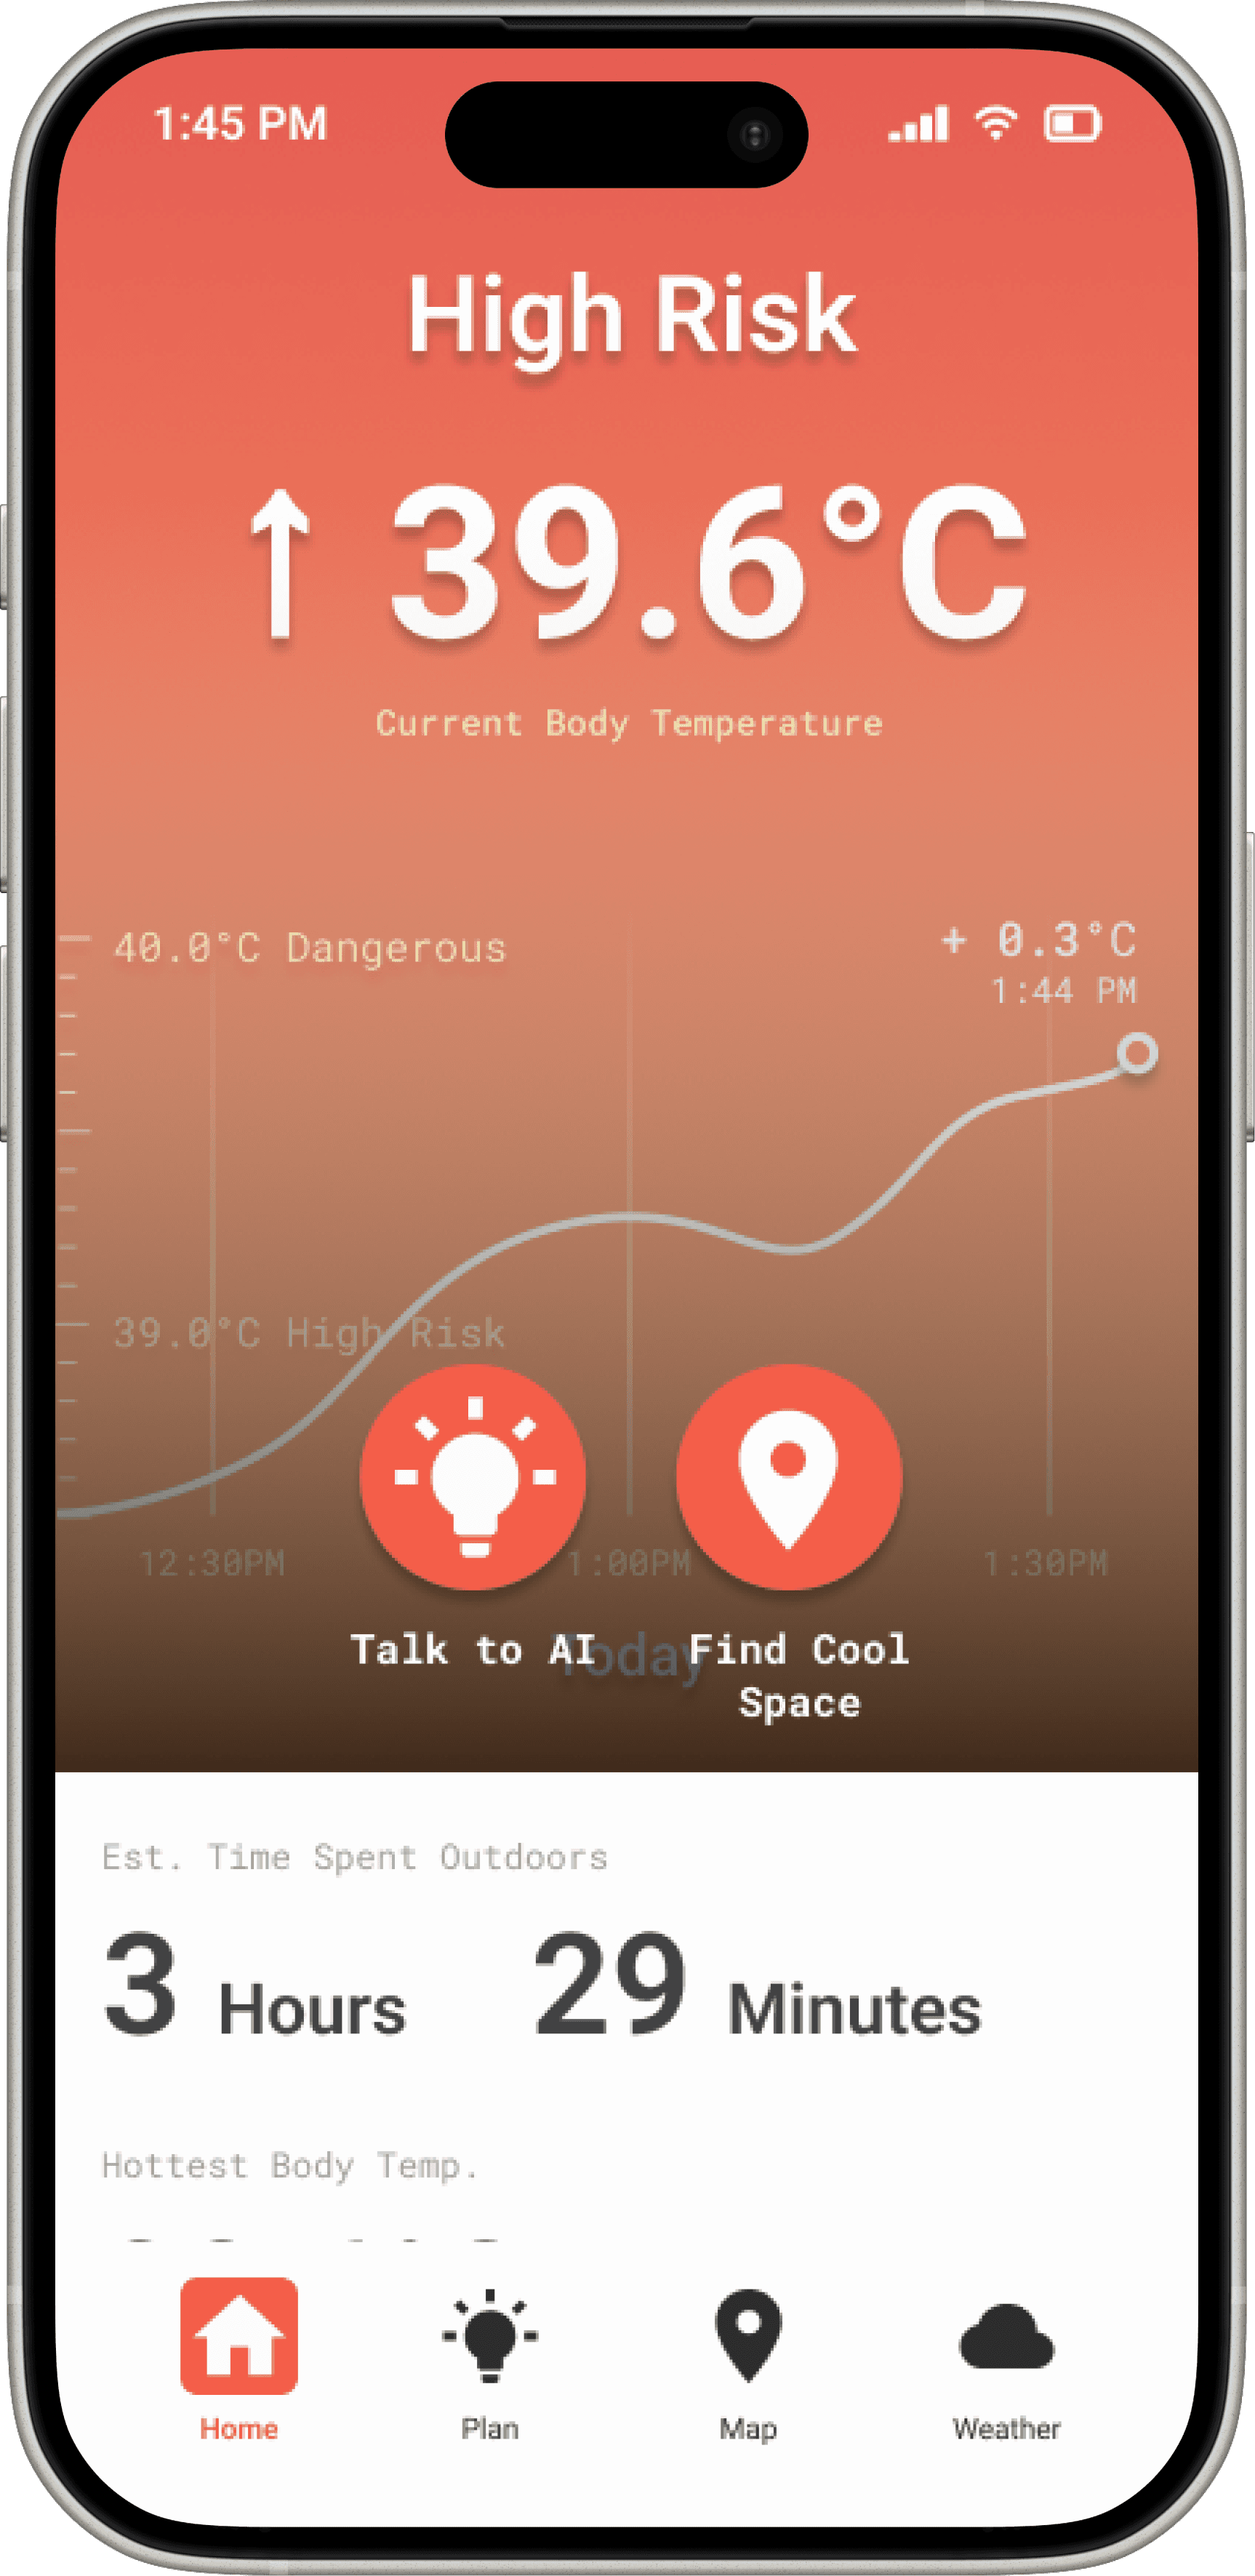
The home screen is crucial as it displays real time information.

We used Cognitive Walkthroughs and A/B testing to find what our users needed immediate access to.

View Our Testing Protocol →

Users wanted glanceable info and proactive suggestions .

We tested these overlays in person with UI UX experts and random users across one whole day.
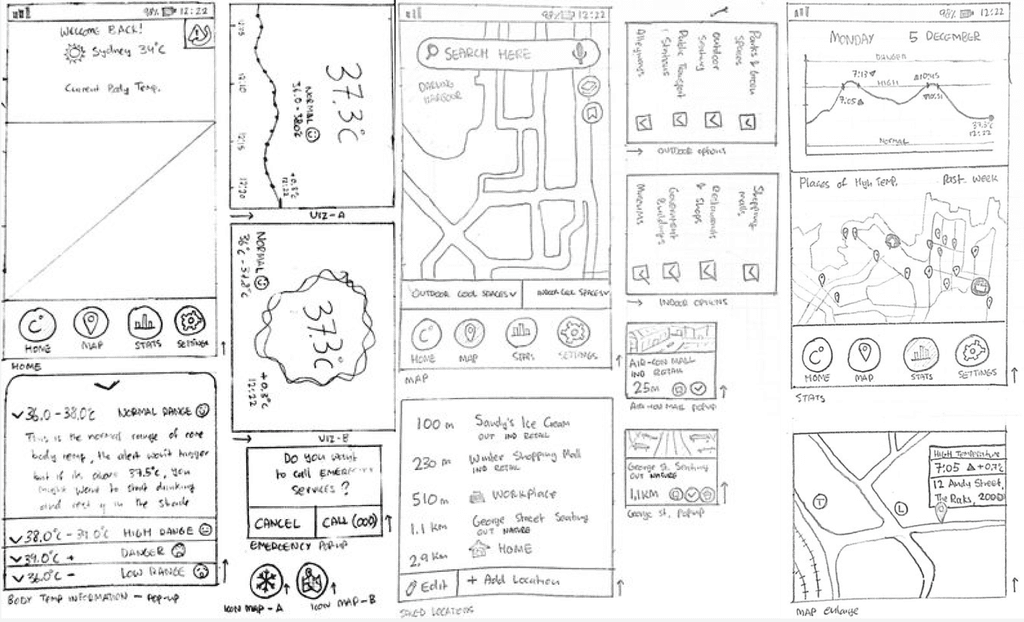
Upon testing, some key themes emerged to guide our direction.

Upon testing,

some key themes

emerged to

guide our direction.

Real Time Cooling Solutions

Users required real-time cooling solutions integrated with familiar services (like Google Maps) for ease of use.

Passive solution

Users preferred subtle, wearable technology that worked passively in the background without requiring active management.

Glanceable UI

Users needed intuitive interfaces that provide quick, glanceable information, especially when they are fatigued or overwhelmed.

Wireframing

Wireframing

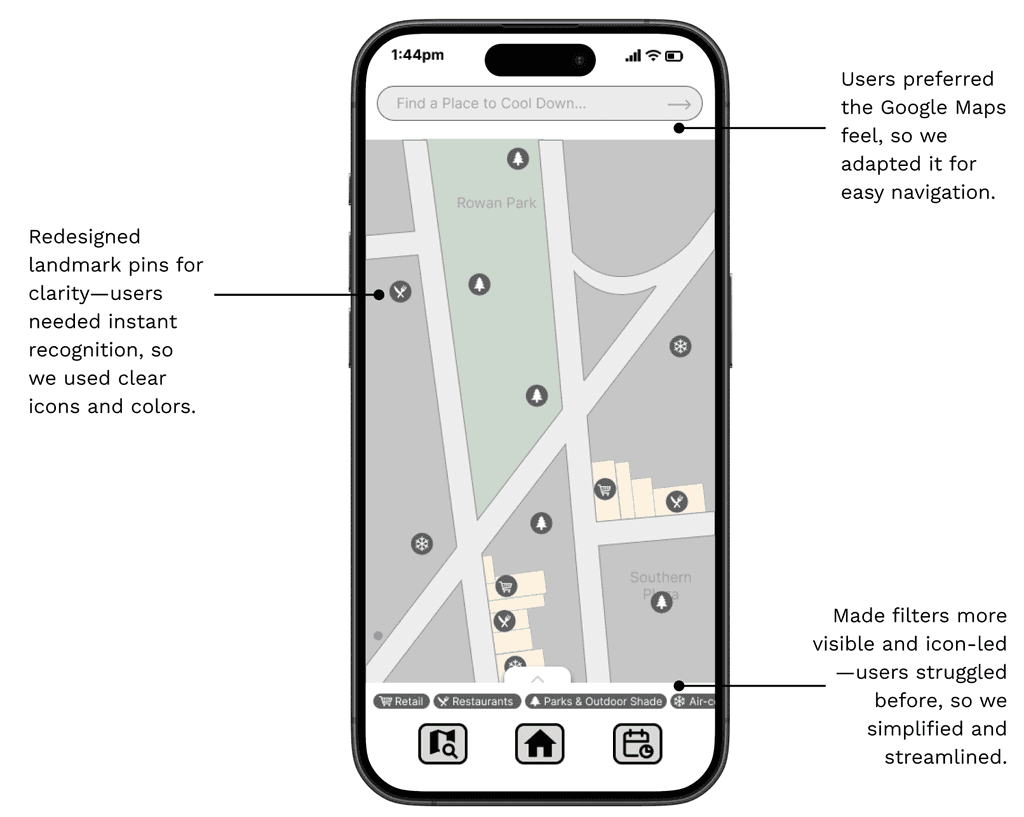
We did 2 iterations of wireframes with user and expert testing.

We did 2 iterations of wireframes with user and expert testing.

Discover --|-- Define --|-- Develop --|-- Deliver

Discover --|-- Define --|-- Develop --|-- Deliver

Feature 1: Tips to Cooldown

Feature 1: Tips to Cooldown

We’ve restructured the UI for clarity, making it easy to find what you need when the heat hits.

We’ve restructured the UI for clarity, making it easy to find what you need when the heat hits.

Feature 2: Navigation

Feature 2: Navigation

We integrated familiar navigation and visual cues for quick, seamless access to nearby shaded parks, water stations, and air-conditioned spots.

We integrated familiar navigation and visual cues for quick, seamless access to nearby shaded parks, water stations, and air-conditioned spots.

Feature 3:
Temperature Log

Feature 3:
Temperature Log

Users remained confused about the purpose of this feature.
Why would they need to check their body temperature?

Users remained confused about the purpose of this feature.
Why would they need to check their body temperature?

Our User Testing Protocol
was comprehensive.

Our User Testing Protocol
was comprehensive.

Below are 3 test goals that guided all of our testing sessions.

View Testing Protocol

Effectiveness

To measure if users can easily find and access personalised information to access cooling and water.

Efficiency

To assesses how quickly users can navigate features, aiming for task completion in under four clicks.

Learnability

To evaluate if first-time users can intuitively understand and interact with the core functions of the app.

Triangulation of Testing Methods

Triangulation of
Testing Methods

Cognitive Walkthrough

Expert-based testing

By discovering users' needs and potential confusions, we can refine the design to be more user-centric.

A/B Testing

User-based Testing

By testing variations of the mid-fidelity prototypes, we could directly measure user preferences and interactions with different UI elements.

Interviews + TA

User-Based Testing

Involves real users verbalising their thoughts. It offers direct insights into users' mental models, frustrations, confusions, and satisfactions.


During the Mid-Fi stage, we chose our home screen
and finalised the third feature.

During the Mid-Fi stage, we chose our home screen
and finalised the third feature.

After incorporating feedback from the mid-fidelity testing, we developed the final high-fidelity prototypes.

This stage involved polishing the interface, adding brand colours, logos, finalising typography, and integrating real-time data interactions to make the app feel more dynamic and responsive.

After incorporating feedback from the mid-fidelity testing, we developed the final high-fidelity prototypes.

This stage involved polishing the interface, adding brand colours, logos, finalising typography, and integrating real-time data interactions to make the app feel more dynamic and responsive.

Try out the High Fidelity Prototype ↓

Our System Usability Scale was 87.

Discover --|-- Define --|-- Develop --|-- Deliver

Discover --|-- Define --|-- Develop --|-- Deliver

With data coming from over 50 users and some experts at the University of Sydney.

With data coming from over 50 users and some experts at the University of Sydney.

Finally, I was responsible for coding the MVP.

This was to demonstrate the feasibility of our design and to showcase our web development skills.
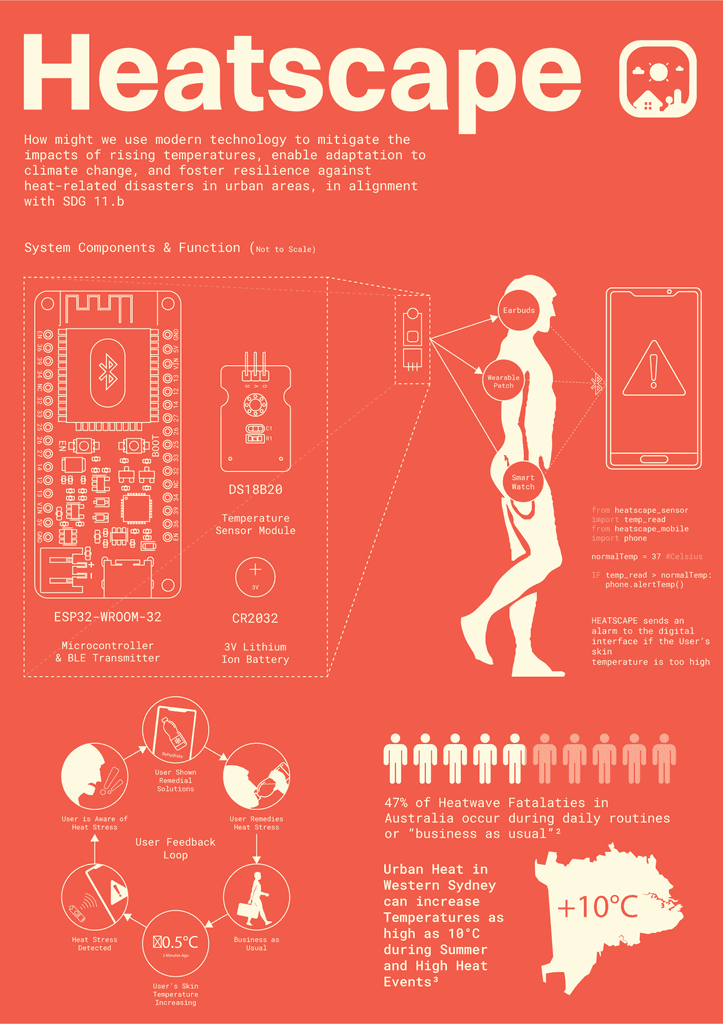
Let me leave you with a poster and some outcomes…

Let me leave you with a
poster and some outcomes…

This project scored a Distinction mark and was the only project amongst many AI concepts to successfully integrate AI with a working prototype in code.

This project scored a Distinction mark and was the only project amongst many AI concepts to successfully integrate AI with a working prototype in code.

GAUTHAM SRINIVAS

GAUTHAM SRINIVAS

Designed by Gautham Srinivas with

+

Create a free website with Framer, the website builder loved by startups, designers and agencies.